 Continuous Integration for Mobile Apps with AppThwack and Jenkins (Part 2)
May 2, 2014
May 2, 2014

Back in September, we announced the initial release of the official AppThwack Jenkins plugin. Since its inception, we’re pleased to see many developers seamlessly integrate AppThwack and testing on real mobile devices into their development workflow; testing on a per-commit and nightly-build basis.
While the plugin was perfect for capturing build artifacts and kicking off automated tests, it lacked Jenkins UI integration for displaying results. Customer feedback showed that this is an extremely important feature and we couldn’t agree more. The benefits of continuous testing are diminished if developers cannot quickly view results and historical trends. This is essential data for promptly diagnosing problems which facilitates a quick development process.
We’ve been adding features over the past few months and as of today (v1.8) of our plugin, we now have real-time AppThwack results right in your Jenkins UI. We have plenty more cool Jenkins features up our sleeves, but we’re happy with the initial release and hope you are too! Let’s jump right in and check it out!

It’s important to see the status of your builds as quickly as possible. The AppThwack plugin now attaches to your project view on the Jenkins homepage to display the status of the latest build.
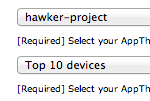
Previously, users were required to enter the names of the project and device pool they wanted to use. This wasn’t very user friendly and was prone to typos. Enough of that foolishness! The project and device pool entry fields are now drop-down selections populated automatically for you.
It’s your data, use it when you need it. Continuous testing generates tons of logs, screenshots and important device specific data imperative for debugging.
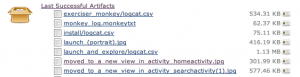
All of these test artifacts are now automatically downloaded and stored as part of every Jenkins build, available for deeper analysis whenever you need it.
Stay hip with the latest trends of your build results.
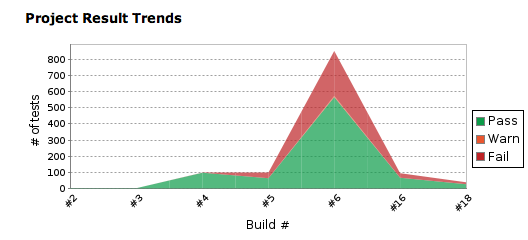
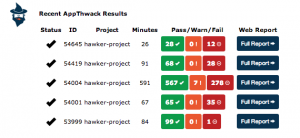
Easily view and identify trends in test passes, failures and warnings for every build and see high level results for your most recent AppThwack runs, right on your Jenkins project homepage.
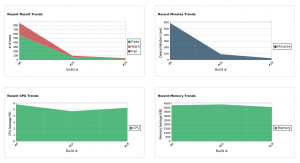
You can also drill down and view the highlights of a single AppThwack run.
This will display all the high level result data you’ve come to expect, including latest trends in performance data (CPU, Memory, Threads, Network Traffic, FPS, etc).
Individual tests are grouped by result (pass/fail/warn) and then by each device, enabling you to quickly identify which test and/or device(s) are encountering errors.
Additionally, each test links back to its own report on AppThwack, allowing for even deeper analysis.
Interested in mobile Continuous Integration using real devices but not sure where to start? Check out our partner CloudBees who specializes in cloud based CI.
This post was migrated from the AppThwack Blog which is no longer available. A copy of the original post can be viewed from archive.org.